- →
outputs the contents of the source code window in SVG (Scalable Vector Graphics) format. Also the non-visible part of the window is exported.
- →
outputs the contents of the source code window in SVG (Scalable Vector Graphics) format. Only the visible part of the window is exported.
- →
outputs the contents of the source code window in EPS (Encapsulated Postscript) format.
- →
exits SLO.
- →
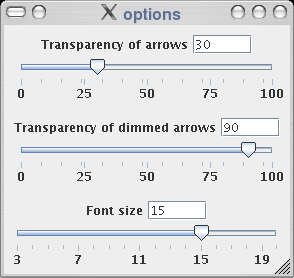
shows up a dialog to set preferences about the transparency of arrows and the font size of the source text. (see screenshot ???)
- →
controls whether arrows are transparent or not.
- →
show linenumbers in the source code
- →
when unselected, all arrows have the same width. When selected, the width (thickness) of the arrows depend on the number of reuses they represent. The thickness is proportional to the percentage of reuses that the arrows represents of the number of reuses that are optimized by the refactoring it belongs to. (For each suggested optimization/refactoring, multiple arrows may be present). An example is given in screenshot.
- →
decreases the minimum length of an arrow. This is mostly important for visualizing arrows for which the source and sink is the same source code.
- →
increases the minimum length of an arrow.
- →
for each source code file, there's a menu item with 'Zoom xxx', where xxx is the source code file name. When the menu option is selected, that file is zoomed, i.e. the source code is drawn (the font size can be selected using the options window, see screenshot ???). When the menu item is unselected, each line in the source code file is represented by a line that is only a pixel in height.
In the histogram window, when clicking on a bar of a specific color, the corresponding optimization is highlighted in the source code window.
When clicking an arrow with the mouse, a menu with two options appears: see screenshot???. The first option, "Set arrow appearance" pops up a dialog box, that allows to set the angle in which the arrow starts and ends. It also allows to set the length of the arrow. The second option, "Show RDH", pops up a window with the histogram of reuse distances of the reuses represented by that arrow.